MINECRAFTBIBLE
Loading...
Output Spigot/Paper memory statistics
Want to find out how much heap space your server really needs? Want to check that your hosting provider is giving you what you paid for? Other plugins, such as Essentials, will provided memory statistics, but they're probably not what you really want to know. MemCheck provides the amount of heap used and the total amount of free heap space in real time.
MemCheck adds a /mem command which outputs the amount of used heap in MB and as a percentage of the maximum heap size, and the total free heap in MB. It also provides statistics about the Java "Metaspace" use. As a bonus, the server's current TPS as calculated by Essentials, the CPU load, the average garbage collection time in the previous minute, and the total number of loaded chunks are shown.
At startup, the number of processors (threads), total physical memory, maximum heap, server view distance, server simulation distance, Java garbage collector name(s), and Java command line options are written to the server log file.
This allows the server owner to see how much memory is being used and if the memory available for additional objects is too small, too big, or just right.
The memory values reported by Essentials come directly from Java, and don't really show what a server owner needs to know. The explanation will be easier with the help of the following diagram from Stackoverflow:
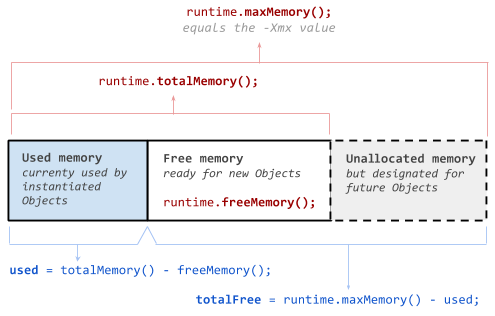
Java provides, and Essentials reports, the three values shown in red. This is not really what a server owner needs. The more relevant values are the two shown in blue at the bottom: used, which is the amount of the heap currently used by the program, and totalFree, which is the amount of memory available for additional objects on the heap. More information is shown below.
/mem - This outputs the current memory statistics. Note that the heap is constantly changing, so you'll see the values change from second to second, as more objects are allocated or the Java garbage collector runs.

The output includes the following:
memcheck.mem - Required to use the mem command. Defaults to op.
None.
This plugin uses the bStats metrics system to provide anonymous usage data. You may opt-out globally by changing plugins/bStats/config.yml. The metrics are available at https://bstats.org/plugin/bukkit/MemCheck
